

Your operation is complex. Your reporting can be extraordinary.
We engineer reporting systems beyond standard PBX templates—turning call records, CRM outcomes, tickets, workforce data and infrastructure signals into the exact KPIs your business needs.
When the requirement list reached 200, we built the engine.
A recent customer needed far more than total calls and queue summaries. The specification crossed agent activity, QA, CSAT, abandoned-call recovery, workforce adherence, omnichannel service, telephony health, custom formulas, alerts and management drill-downs. We engineered a reporting layer capable of answering the complete requirement—not another static export.
Standard PBX data is the starting point—not the limit.
Core 3CX reports remain valuable. We extend them when the business question requires calculated, connected or historical context that a PBX alone cannot know.
Define the formula your operation actually uses
AHT, occupancy, utilisation, productivity, transfer rate, FCR and service level can be documented and calculated around your agreed methodology.
Join calls to what happened next
Connect CRM, ticketing, surveys and dispositions so reporting can identify resolution, customer reason, callback outcome and satisfaction.
Move from totals to evidence
Click a KPI to inspect its underlying calls, compare teams and periods, filter by customer or outcome and trace why performance changed.
One engine. Every operational question in the right context.
Views are designed for executives, managers, supervisors and agents without forcing every audience into the same dashboard.
Calls, queues and service levels
Offered, answered, missed, abandoned, wait, hold, talk, transfer, time distribution and comparative trends.
Agent activity and performance
Login, availability, busy, idle, break, productivity, occupancy, utilisation and team-level comparisons.
QA, recordings and coaching
Structured evaluation forms, scores, trends, coaching history, acknowledgement and recording-level evidence.
CSAT and customer outcomes
Overall, queue and agent CSAT, negative-result alerts, comments, FCR and outcome reporting.
Abandoned and missed-call recovery
Pending callbacks, owner, response time, outcome, recovery rate and drill-down to the affected calls.
Adherence and staffing insight
Planned versus actual login, break adherence, late starts, early exits, peak-hour analysis and staffing needs.
Voice, WhatsApp, email and tickets
Unify interactions, first response, resolution, SLA, overdue work and customer history across connected channels.
Telephony and infrastructure health
Uptime, trunk status, outages, failover, failed calls and available quality or monitoring telemetry.
We combine the systems that each know one part of the truth.
A PBX knows the call. A CRM knows the customer. A ticketing system knows the issue. A workforce source knows the schedule. Monitoring knows the infrastructure. The reporting engine joins those perspectives into one governed model.
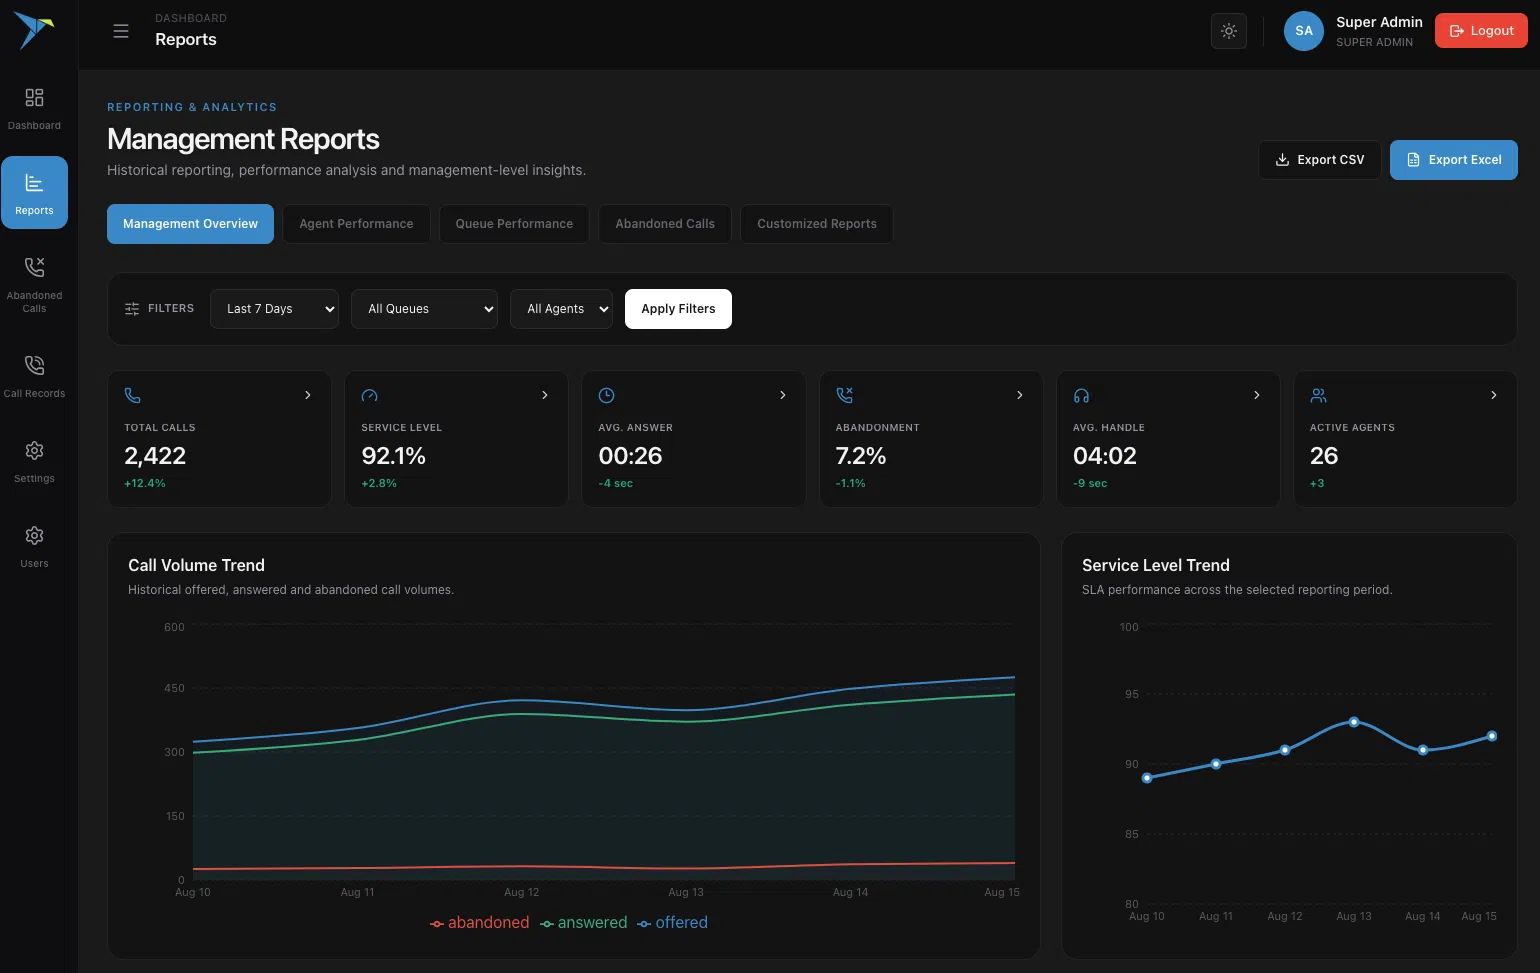
A dashboard should explain, not merely decorate.
We create interactive reporting views where leaders see the headline, supervisors see the cause and authorised users can investigate the supporting calls or records.
Definitions first. Dashboards second.
Extraordinary reporting begins with trusted definitions and traceable source data.
Ask the decisions
Identify what each role must know, investigate and act upon.
Audit the sources
Confirm which systems hold each event, outcome and identity.
Define every KPI
Agree formulas, exclusions, targets, refresh and retention rules.
Build & reconcile
Engineer the model and prove outputs against source records.
Release by audience
Deliver governed views, alerts, exports and scheduled reports.
If the report does not exist, we can engineer it.
Bring us the management questions, KPI formulas and disconnected data sources. We will map the reporting engine needed to answer them.