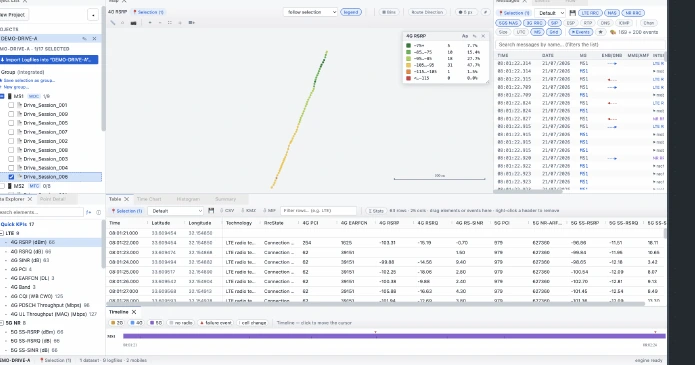
DriveLens is the drive-test analysis product on SONIC, VoIPBird’s RF automation platform. Import a whole cluster of logs, run automated analyses, and get plain findings with the signaling and the map attached, plus a report your team can edit and send. It works on any operator’s network.

What DriveLens Does

Today, reading a drive test means scrolling through logs chart by chart and pasting screenshots into slides—hours per cluster, every round. DriveLens turns that into four simple steps.

📥

Import

A whole cluster of drive-test logs at once.

⚙️

Analyze

Seven automated insights, one click each.

🔍

Findings

Root cause, with the evidence attached.

📤

Report

Editable PPTX, PDF reports and coverage maps.

Seven analyses, each answering one question

Every finding names the fault and carries its proof: the L3 signalling, the measurements, and the exact point on the route. Nothing is a black-box score.

🎙️

Voice & MOS

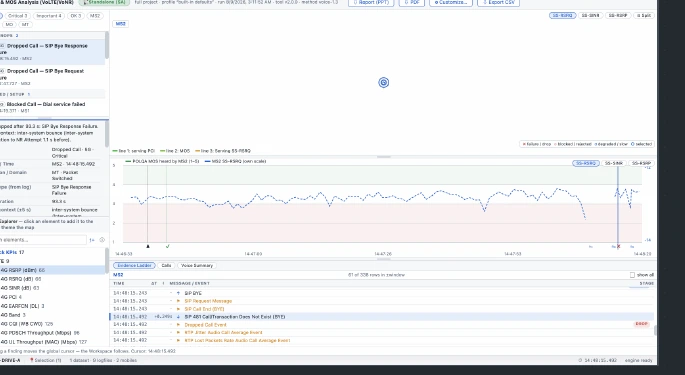
POLQA voice quality for VoLTE and VoNR, judged by the distribution tail (p10), not just the average. Detects one-way audio and explains every poor span.

Was the call quality good, and where did it break?
🔀

Handover

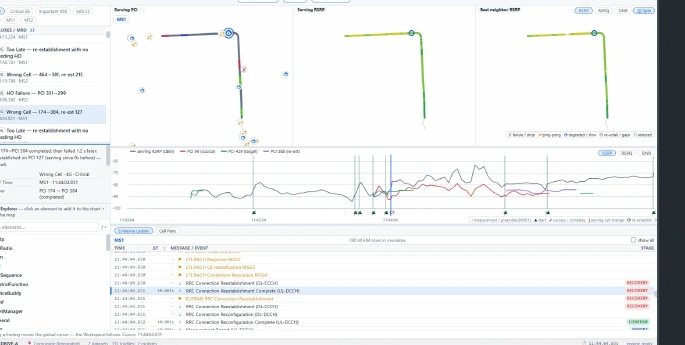
Tracks every handover and classifies failures the way an MRO engineer would: too late, wrong cell or ping-pong, with the cell pair and trigger.

Did mobility work, and where did it fail?
📶

RACH & Accessibility

The front door of the connection: random access, RRC setup and registration. Groups failures into bursts and decodes the causes.

Can the phone get on the network?
🌐

Coverage & Interference

Places every sample in the RF quadrant to separate a coverage hole from an interference problem, with the distribution tables an acceptance report quotes.

Coverage problem, or interference?
📡

Sector Audit

Catches swapped feeders and cells overshooting their design footprint, cross-checked against the drive geometry so route shape cannot cause a false alarm.

Is each sector pointing where it should?
📈

Throughput & Retransmission

A layer-by-layer waterfall from APP to PDCP, RLC, MAC and PHY that identifies where throughput is lost, with BLER and mobility events on the same timeline.

Where is throughput being lost, and at which layer?
🛰️

5G Presence & EN-DC

Tracks the full 5G attach funnel, flags SCG failures and churn, and proves real 5G coverage gaps. It also catches a phone that never even tries 5G.

Is the phone getting onto 5G, and staying there?

Built to Your Requirement

The engine extends. New analyses, custom KPIs and further technologies, including 2G and 3G, are built around what the client needs. A request is a build, not a dead end.

Need something specific? We build it.

It explains the problem, not just the data

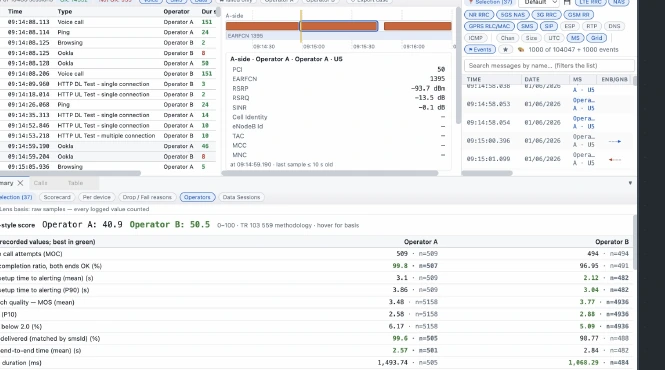
Click a finding and the whole workstation jumps to that moment: the map, the chart and the signaling trail all move together. The finding tells you the cause and shows the evidence behind it.

  • Evidence attached to every finding: messages, samples, map location
  • Root cause, not just a KPI that dropped
  • Tunable rules you can set to your own targets
  • 4G LTE and 5G NR, SA and NSA, any RAN vendor

Reports your team can actually edit

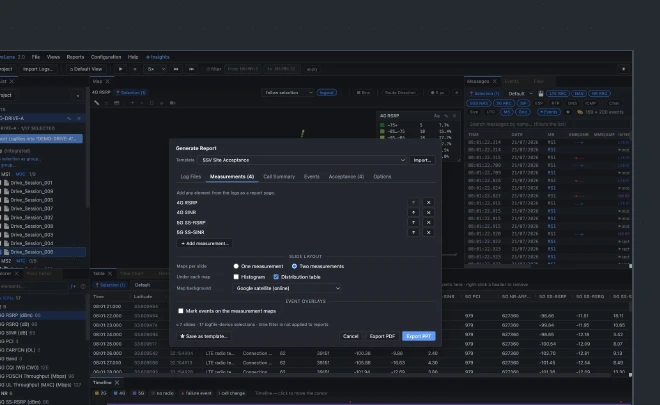
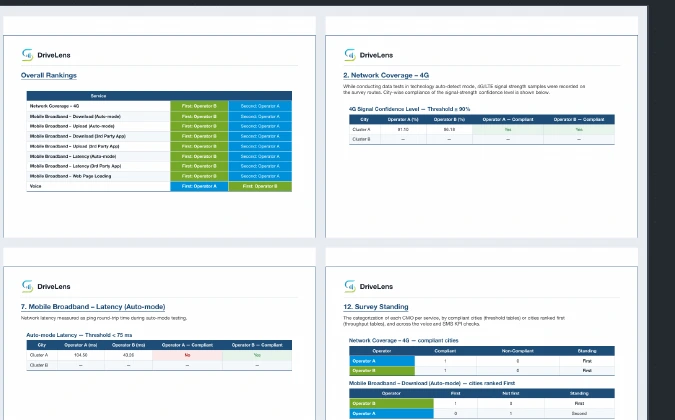
One click produces an editable PowerPoint, a locked PDF, and standard coverage maps for Google Earth and MapInfo. The cluster owner opens the report, adds their comments, and sends it upward the same day, the way drive-test reports are really used.

  • Editable PPTX built from real shapes, not a flattened picture
  • Theme maps in KMZ and MapInfo, binned to standard RF legends
  • Full data export to Excel for the teams that want the raw numbers