

Live operational intelligence · Dubai
Do not wait for the report. Run the operation live.
VOIPBIRD builds dynamic dashboards for frontline teams, management and directors—powered by customised algorithms that turn live events into the exact decisions each audience must make.
Role-specific viewsCustom algorithmsLive intervention
VOIPBIRD · LIVE OPERATIONS● LIVE ·
LIVE DEMAND · LAST 60 MINUTESUPDATED NOW
AGENT CAPACITYLIVE
Support queue approaching SLA threshold
QUEUE / GROUPWAITINGSLAAVAILABLESTATE
Sales0394%08HEALTHY
Support0488%03WATCH
Service0097%01HEALTHY
QueuesAgentsService levelLongest waitAbandonmentRecoveryCustom KPIsAlertsBranchesDirector viewQueuesAgentsService levelLongest waitAbandonmentRecoveryCustom KPIsAlertsBranchesDirector view
01 One operation · three perspectives
The right dashboard changes with the person looking at it.
We do not force teams, managers and directors into one overloaded screen. Each view uses the same governed data but prioritises different decisions.
What needs attention this minute?
Fast, high-contrast visibility for supervisors, wallboards and active teams.
- Calls waiting and longest wait
- Agent availability and status
- Queue SLA and threshold alerts
- Exceptions requiring intervention
Why is performance moving?
Team and queue context for managers balancing demand, capacity and quality.
- Answer and abandonment trends
- AHT, FCR and recovery
- Team comparison and drill-down
- Capacity and workload signals
Is the operation delivering the target?
Condensed business visibility across locations, channels and service commitments.
- Executive service indicators
- Branch and business-unit roll-up
- Customer outcome measures
- Target variance and strategic risk
02 Custom algorithm layer
The value is not the widget. It is the logic behind it.
Your dashboard may need a custom service-level formula, excluded short abandons, weighted performance, queue recovery, branch comparison or a completely original score. We document the inputs and build the calculation around the operating definition.
03 Dynamic capability
Built around your queues, your targets and your decisions.
Every dashboard begins with the operational questions—not a catalogue of fixed widgets.
Demand and wait visibility
Calls waiting, longest wait, offered, answered, abandoned and queue-specific health.
Capacity as it changes
Available, talking, wrapping, away, break, offline and custom interpreted states.
Customer-specific KPIs
Formula-driven SLA, AHT, FCR, occupancy, productivity, recovery and target indices.
Thresholds that trigger action
Visual states and notifications when wait, abandonment, capacity or service moves outside policy.
From number to evidence
Move from a headline KPI into the queues, agents, calls or outcomes contributing to it.
Branches in one governed view
Compare locations and consolidate performance without losing local detail.
More than voice
Combine connected WhatsApp, ticketing, email, CRM and customer outcome data where available.
Wallboard to boardroom
Purpose-designed layouts for floor displays, laptops, management screens and executive summaries.
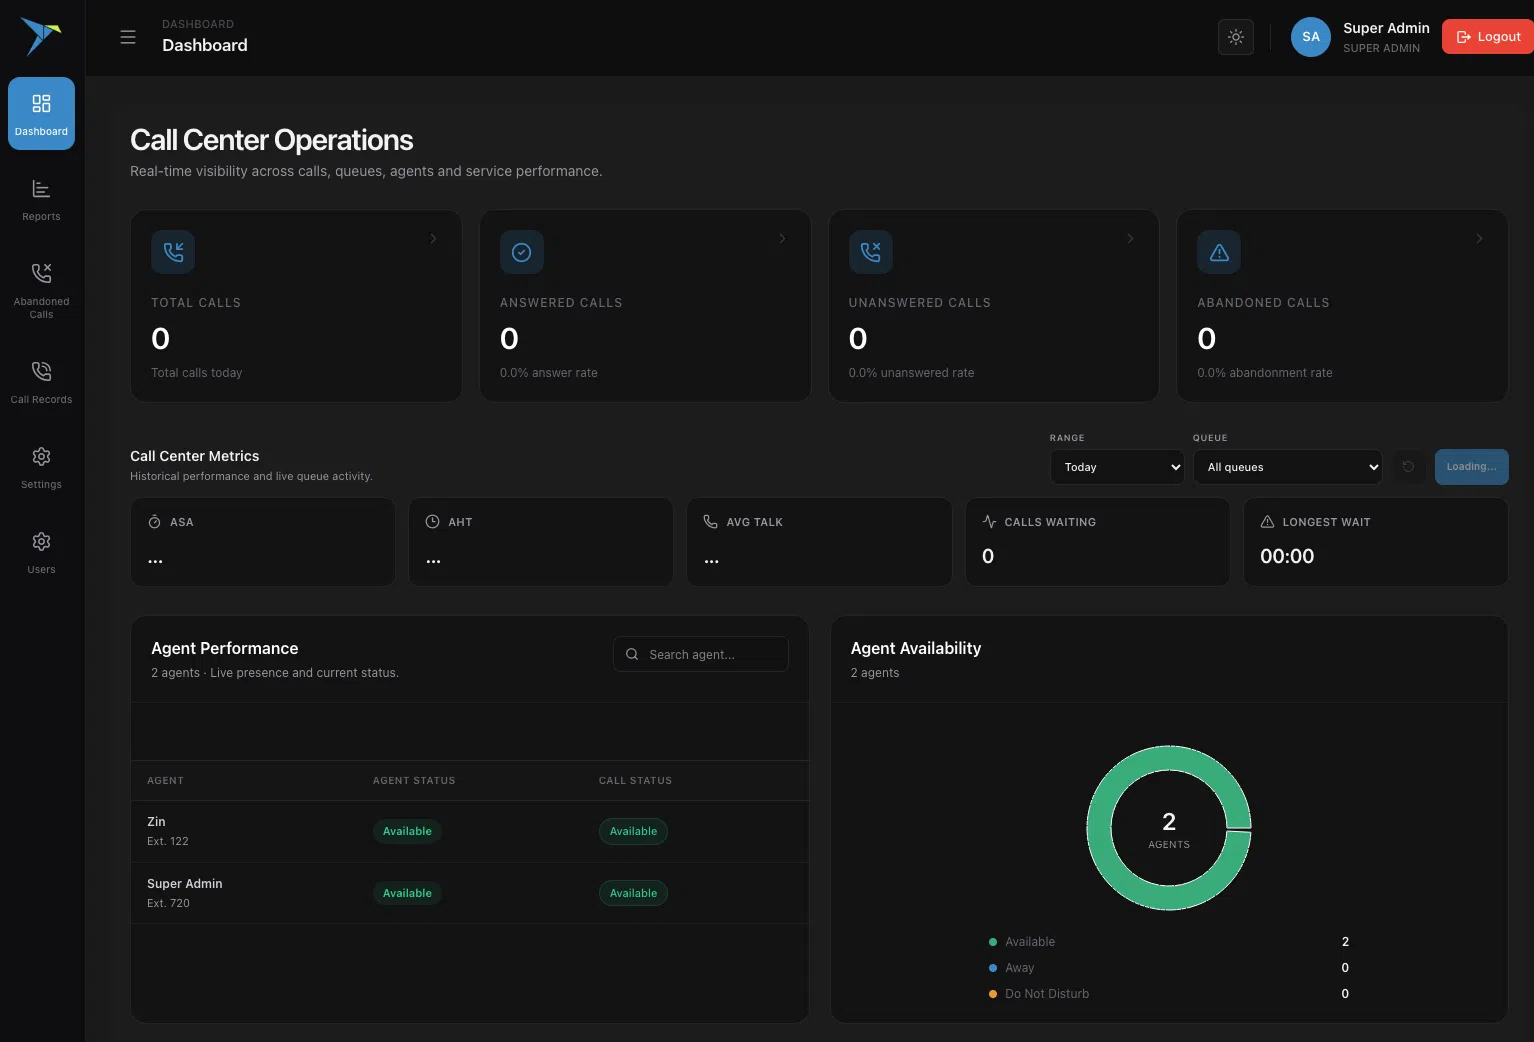
04 Built, not imagined
Live visibility already engineered for real operations.
Our dashboard capability brings call activity, queue demand, agent state and performance context into a focused operational environment. The next deployment is shaped around your data and management model.
Live operationsAgent performanceQueue intelligenceManagement reportingCRM outcomesRecording contextCustom thresholdsRole-based views
05 Dashboard engineering
Start with the decision. Then engineer the signal.
We prove definitions and refresh behaviour before making the screen beautiful.
Map audiences
Define what teams, supervisors, managers and directors must decide.
Audit live sources
Confirm events, refresh rates, identities and data limitations.
Define algorithms
Agree formulas, targets, exceptions and threshold behaviour.
Build & reconcile
Validate the live view against source events and known scenarios.
Release & improve
Deploy by audience and refine using real operational feedback.
Build the dashboard your operation deserves.
Show us who needs visibility, what decisions they make and which systems hold the live signals. We will engineer the view around them.